A New Tool for SEO,Google Search Console Insights.

What is Google Search Console Insights?
And it will help you better understand how people discover your site’s content and what resonates most with them.
Today we’re going to share everything you need to know (and why you need to know it) about the Google Insights tool. Here’s what we’ll cover:
- What is Search Console Insights?
- How to Access Search Console Insights
- Search Console Insights Walkthrough
- Is it Better than Google Analytics and Search Console?
- How Search Console Insights Benefits SEO and Content Marketing
GSC Insights is designed to upgrade your organic analytics. Which is great news for digital marketers. Because if there’s one thing digital marketers love it’s sweet, bountiful data.
What is Search Console Insights?

Search Console Insights is an alternative, enhanced method to view your site’s organic data. The platform is specifically tailored for content creators and publishers.
Google describes Search Console Insights as “a way to provide content creators with the data they need to make informed decisions and improve their content.”
More specifically, Insights pulls data from both Search Console and Google Analytics into a single report. This snapshot displays trends, performance and user activity as it relates to your pages.

How to access Search Console Insights
Getting started with Google Search Console Insights is really easy. There are several ways to set it up.
- Visit this page
- Select Search Console Insights from the top of your Search Console overview screen
- In the iOS Google App, select Search Console Insights in the account menu
Below is shown where you access Insights within Google Search Console. Whichever property you have showing in the right sidebar is the one Insights will report on.

What does Search Console Insights provide?
Google Search Console Insights seeks to help you answer the following questions:
- What are your best performing pieces of content, and which ones are trending?
- How do people discover your content across the web?
- What do people search for on Google before they visit your content?
- Which article refers users to your website and content?
To find the answers to those questions, Insights organizes data into two categories:
- Site Overview
- How People Find You
Let’s walk through each of the sections found in those categories.
Search Console Insights walkthrough
The Search Console Insights dashboard is very user-friendly. It
presents data in a straightforward, easy to understand manner that lets
you find key data without spending time filtering for it or having to
have an advanced degree in SEO analytics.
The main dashboard shows
data related to your entire site. For data specific to each page you can
select any of the pages that appear in the “Recent Content” and “Most
Popular Content” sections.
Here are each of the sections provided by Search Console Insights:
Page Views
The report starts with an “Overview” of your site, highlighting high performing pages.
The first section graphs your page’s views over the past 28 days, and shows the average time spent on page over that time period.

The percentages under each total highlight the change in figure from the first day compared to the last. By selecting any point on the graph you can see the page view count for a specific date.
New Content
The next section shows content you’ve created within the last 28 days.
If you haven’t published any new pages or content within that time, this section will be blank.
Most Popular Content
The final section in the “Overview” category shows your site’s most popular content.
Here you’ll find the 15 most popular pages on your site over the past 28 days. These are ranked in order by page views (shown next to the eye icon).
This section also displays average time spent on each page, as well as a preview of the top search queries driving people to that page from the Google search engine results page (SERP).
If you select an item, you’ll be brought to a new screen providing detailed insights specific to that page related to the sections found in “How People Find You.”
Top Traffic Channels
After the “Overview” category comes the “How People Find You” category. Its first section charts your site’s top traffic channels.

There are three possible channels provided:
- Organic Search – traffic from any search engine like Google or Bing
- Direct – traffic from link clicks other than those found on search engines, social media or other sites. This could include browser bookmarks or links sent to someone in email.
- Referral – traffic from people clicking links found on other websites
Top Traffic Channels
The next section showcases the top 50 search queries (aka keywords) driving people to your site from Google’s search engine. They are ranked in order by the number of times they were clicked on in a Google SERP.

Under each query, that term’s average rank position is provided.
By default this list shows the “Most Searched Queries.” If you toggle the dropdown, you can switch to the “Most Trending Queries.” This list shows which search queries grew the most by clicks in the current vs previous 28 days.
Link Referrals
Here we see a breakdown of link referrals to your site. The default list shows the “Top Referring Links” from other sites to yours, including how many page views the link generated and which page it linked to.

By selecting the dropdown you can switch to a list of the “Newest Referring Links” over the last 28 days.
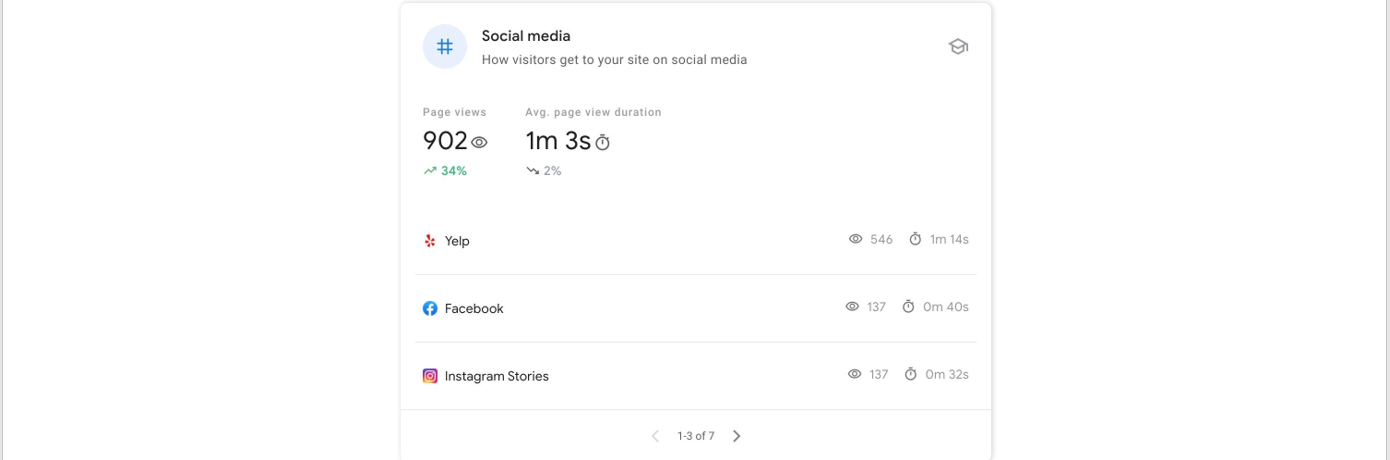
Social Media
The final section of the Insights report details how people get to our site from social media. Specifically, it ranks the social media platforms according to the page views they generated.
If at any time you need help deciphering what any of the data from these sections mean or how you can use it to improve performance, just tap the graduation cap in the upper right hand corner of each section.
As of writing these were all the sections provided by Google Search Console Insights. However, don’t be surprised if this dashboard grows and they add more data as time goes by.
Search Console Insights vs Google Analytics vs Search Console
Search Console Insight is a user-friendly extension of Google’s other organic analytics tools, compiling a specific dataset from them.
In brief, here’s what each tool offers:
- Google Analytics – tracks your website, content, social media and app activity at a granular level, as well as measures advertising ROI
- Google Search Console – measures organic traffic, identifies performance issues, and helps improve SEO
- Google Search Console Insights – identifies how people discover your content and your site’s top performing content
Google Analytics and regular Search Console provide a lot more valuable data than Insights. So by no means should you treat Search Console Insights as replacement for either of those. Nor should you rely on it as your sole means of organic analytics.
Where Insights shines is its simplicity and specificity.
Google Insights is best used by publishers and content creators (like bloggers) to identify what resonates most with their audience and how that audience is engaging with their content. It is a tool to update and craft higher performing content that generates larger volumes of traffic to your site.
But content creators aren’t the only ones that can benefit from this data.
How Search Console Insights benefits SEO and content marketing
The digital space is filled with opportunities. Too many opportunities. Chasing after every opportunity that trends your way can easily spin your business (and budget) out of control. Not to mention spread your resources thin.

One of the biggest challenges digital marketers face is narrowing down the scope of their efforts to the most effective strategies and content. Identifying this content isn’t always easy. Fortunately, Search Console Insights provides some major help.
One of its best features is highlighting high performing pages.

Here Google is telling us that people spend much more time on this blog post than they do on others. That’s another way of saying it has a low bounce rate.
This holds up when we compare the figures.
This post has an average page duration of over 6 minutes. The site average is 1 minute 30 seconds. Comparatively, this page is doing something right that we want to emulate. The conclusion here is that we should create more content like this post.
Overall, this is a very quick and easy way for both a content creator and SEO manager to identify new ways to drive higher traffic to the site.
In fact, every section of the Search Console Insights report offers similar benefits. Here are a few examples:
- New Content and Popular – find out which pieces are performing well and which aren’t so you can double down with similar content to high performers and shift away from poor performing topics
- Link Referrals – identify other sites generating high volumes of page views for your site. They are ideal targets for backlinking. Reach out to them and share additional linking opportunities.
- Social Media – identify which social media platforms are generating the highest volume of page views. Adjust your strategy to create more organic content for top performers and less for low performers.
Keywording. Backlinking. Content Creation.
These are fundamental components of SEO and content marketing.
With Google Search Console Insights you can gather insightful data about your audience to make more informed decisions about your digital marketing strategies.
What’s not to love?
Post a Comment